
What You’ll Learn
- Access the raw server response from failed connections
- Render the response as readable HTML
- Identify which security layer blocked the request
- Find the information needed to whitelist your Dashboard
Prerequisites
- MainWP Dashboard installed and activated
- A child site that fails to connect
- Access to an HTML rendering tool (like CodePen)
View the Server Response
1
Trigger the connection error
Attempt to connect a child site. When the connection fails, MainWP displays an error message with a link to view the server response.
2
Open the response modal
Click the link in the error message to open a modal window showing the raw server response.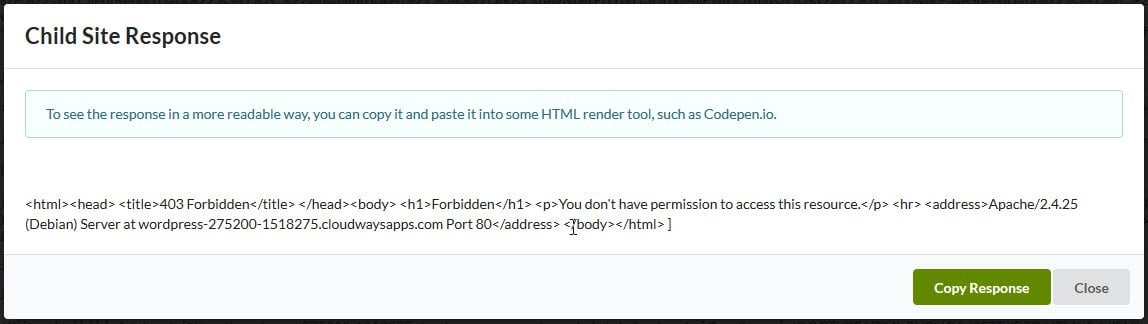
3
Copy the response
Click the Copy button to copy the raw HTML response to your clipboard.
4
Render the HTML
Paste the response into an HTML rendering tool like CodePen to view it as formatted HTML.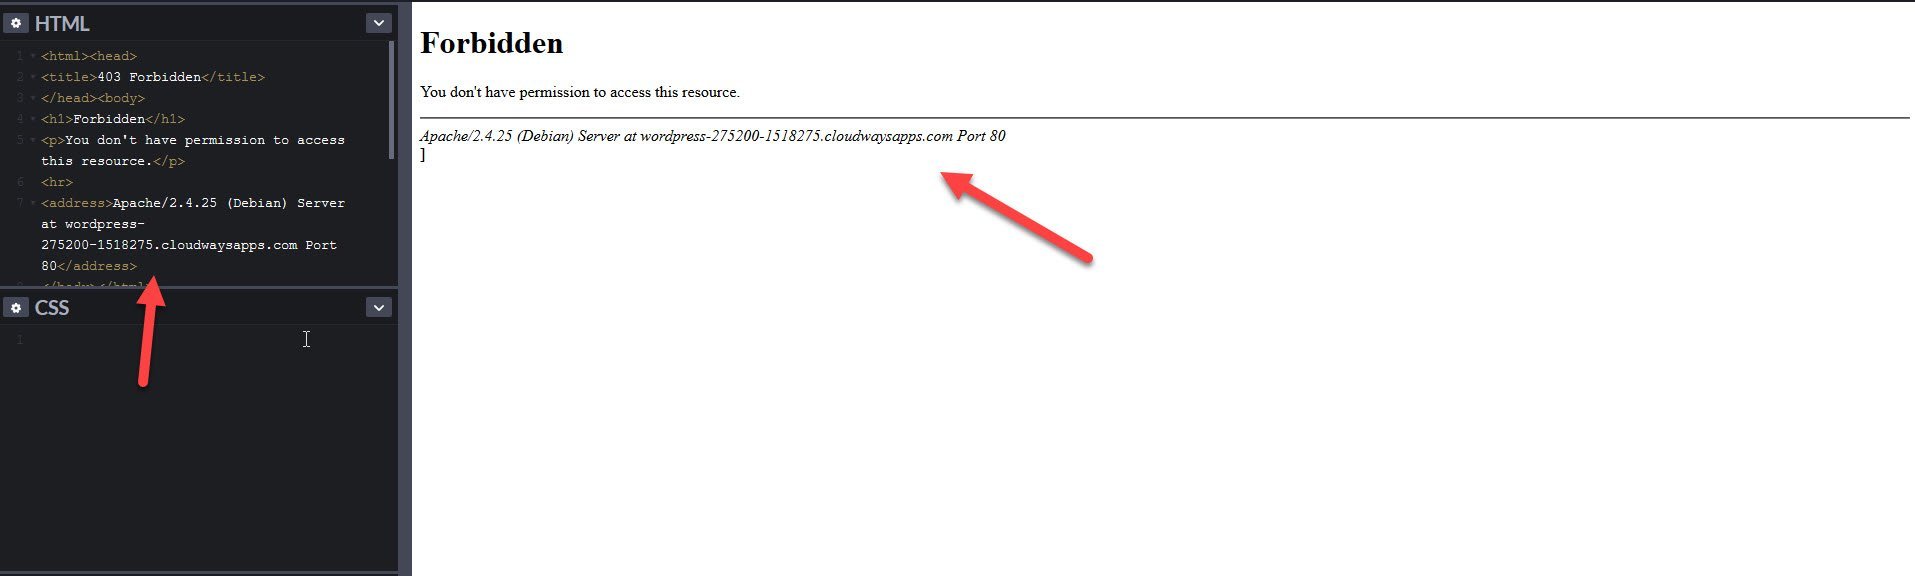
5
Identify the block
The rendered response typically shows:
- Which security layer blocked the request (ModSecurity, Cloudflare, Imunify360, etc.)
- The security rule that was triggered
- The IP address being blocked
Common Information in Responses
Next Steps
Once you identify the blocking security layer:- ModSecurity - Add an exclusion rule for your Dashboard IP. See ModSecurity troubleshooting.
- Imunify360 - Whitelist your Dashboard IP in WHM. See Imunify360 troubleshooting.
- Cloudflare - Create a firewall rule to allow your Dashboard IP. See Cloudflare troubleshooting.
- Other firewalls - Contact your hosting provider with the response details.
Self-Check Checklist
- Viewed the raw server response from the connection error
- Rendered the response as HTML to make it readable
- Identified the security layer blocking the connection
- Noted the Dashboard IP address or rule ID to whitelist
- Applied the appropriate fix for the security layer
Related Resources
- Troubleshoot Connection Problems - Comprehensive connection troubleshooting
- Connection Test Status Codes - Interpret HTTP error codes
- Enable Error Logging - Debug with WordPress logs